Market Outlook
August 19, 2016
Market Cues
Domestic Indices
Chg (%)
(Pts)
(Close)
Indian markets are likely to open in negative note tracking SGX Nifty.
BSE Sensex
0.4
118
28,123
Nifty
0.6
49
8,673
US markets have moved modestly higher in morning trading on Thursday, adding to
the slim gains posted in the previous session. Buying interest has remained relatively
Mid Cap
0.4
56
12,968
subdued, however, limiting the upside for the markets.
Small Cap
1.0
123
12,404
Bankex
1.6
358
22,196
The European markets ended Thursday's session with modest gains, snapping a 4
session losing streak. The markets got off to a positive start, but were stuck in a
sideways trend throughout the session. Investors had a positive reaction to the
Global Indices
Chg (%)
(Pts)
(Close)
minutes from the most recent Federal Reserve meeting, which were released after
Dow Jones
0.1
24
18,598
the European close yesterday.
Nasdaq
0.2
11
5,240
Indian markets eked out modest gains on Thursday after the minutes from the
FTSE
0.1
10
6,869
Federal Reserve's July monetary policy meeting showed that officials were still split
Nikkei
(1.6)
(260)
16,486
over the timing of the next interest-rate rise despite a strong rebound in employment
Hang Seng
1.0
223
23,023
in June.
Shanghai Com
(0.2)
(5)
3,104
News Analysis & Result Review
Result Review: India Cements
Advances / Declines
BSE
NSE
Detailed analysis on Pg2
Advances
1,683
1,077
Investor’s Ready Reckoner
Declines
1,023
521
Unchanged
177
89
Key Domestic & Global Indicators
Stock Watch: Latest investment recommendations on 150+ stocks
Volumes (` Cr)
Refer Pg5 onwards
BSE
3,127
Top Picks
NSE
19,449
CMP
Target
Upside
Company
Sector
Rating
(`)
(`)
(%)
Amara Raja
Auto/Auto Ancillary
Buy
920
1,076
17.0
Net Inflows (` Cr)
Net
Mtd
Ytd
HCL Tech
IT
Buy
786
1,000
27.3
FII
781
7,259
38,141
HDFC Bank
Financials
Accumulate
1,251
1,350
7.9
MFs
(49)
(244)
8,545
Bharat Electronics
Capital Goods
Buy
1,226
1,414
15.3
Navkar Corporation Others
Buy
195
265
35.8
Top Gainers
Price (`)
Chg (%)
More Top Picks on Pg3
Jubilant
489
11.6
Key Upcoming Events
Jpinfratec
8
8.9
Previous
Consensus
Date
Region
Event Description
Reading
Expectations
Bharatfin
796
6.8
Aug 23
US
New Home sales
592.0
579.0
Gspl
153
6.6
Aug 23 Germany
PMI Services
54.4
--
Renuka
16
6.0
Aug 24 Germany
PMI Manufacturing
53.8
--
Aug 26
US
GDP QoQ (Annualised)
1.2
1.1
Top Losers
Price (`)
Chg (%)
Aug 26
UK GDP YoY
2.2
--
6.(
Centralbk
101
(4.7)
More Events on Pg4
Star
1,021
(3.6)
Coalindia
339
(2.6)
Il&Fstrans
66
(2.4)
Mfsl
507
(2.1)
As on August 18, 2016
Market Outlook
August 19, 2016
Result Review:
India Cements
India Cements Ltd on Thursday posted a 16.34% jump in standalone net profit to
`44cr in the quarter ended on June 30. The company's net profit during the same
quarter a year ago stood at `37.8cr. However, total income from operations
decreased from `1,225.7cr in the year-ago period to `1205.7cr in the first
quarter. Indian cenments said that authorities had issued a provisional attachment
order under the Prevention of Money Laundering Act 2002 attaching certain assets
of the company for aggregating value of `120.34cr. The company, based on the
legal opinion, has appealed against the said order to the Appellate Authority.
Economic and Political News
Milk powder exports may start from next quarter
India to soon allow banks to pledge corporate bonds to borrow from RBI
Govt imposes anti-dumping duty on cold-rolled flat steel items
Corporate News
HDFC Bank plans 200-seater BPO in Odisha
Wipro picks up minority stake in Israeli firm for $1.5 mn
Govt slaps $380 million additional penalty on RIL
Quarterly Bloomberg Brokers Consensus Estimate
Tata Power Co Ltd Consol - Aug 23, 2016
Particulars (` cr)
1QFY17E
1QFY16
y-o-y (%)
4QFY16
q-o-q (%)
Net sales
9,275
9,235
0.4
9,375
(1.1)
EBITDA
1,995
2,181
(8.5)
1,913
4.3
EBITDA margin (%)
21.5
23.6
20.4
Net profit
341
241
41.3
360
(5.3)
Market Outlook
August 19, 2016
Top Picks ★★★★★
Large Cap
Market Cap
CMP
Target
Upside
Company
Rationale
(` Cr)
(`)
(`)
(%)
To outpace battery industry growth due to better technological
Amara Raja Batteries
15,715
920
1,076
17.0
products leading to market share gains in both the automotive
OEM and replacement segments.
Uptick in defense capex by government, coupled with BELs
Bharat Electronics
29,423
1,226
1,414
15.3
strong market positioning, indicate good times ahead for BEL.
HCL Tech
1,10,822
786
1,000
27.3
Stock is trading at attractive valuations & factors all bad news.
Strong visibility for a robust 20% earnings trajectory, coupled
HDFC Bank
3,16,771
1,251
1,350
7.9
with high quality of earnings on account of high quality retail
business and strategic focus on highly rated corporates.
Back on the growth trend, expect a long term growth of 14% to
Infosys
2,35,276
1,024
1,370
33.7
be a US$20bn in FY2020.
Strong market positioning within the domestic AC markets to
Voltas
12,102
366
407
11.3
continue, EMP business set to revive
Source: Company, Angel Research
Mid Cap
Market Cap
CMP
Target
Upside
Company
Rationale
(` Cr)
(`)
(`)
(%)
Among the top 4 players in the consumer durables segment.
Bajaj Electricals
2,558
253
277
9.4
Improved profitability backed by turn around in E&P segment.
Strong order book lends earnings visibility.
Favourable outlook for the AC industry to augur well for
Cooling products business which is out pacing the market
Blue Star
4,671
490
527
7.6
growth. EMPPAC division's profitability to improve once
operating environment turns around.
Strong loan growth backed by diversified loan portfolio and
Equitas Holdings
6,030
180
235
30.7
adequate CAR. ROE & ROA likely to remain decent as risk of
dilution remains low. Attractive valuations considering growth.
Expectations of above average monsoon augurs well for
Goodyear India
1,261
547
631
15.4
Goodyear India as it derives ~50% of its turnover from farm
tyre segment.
Commencement of new projects, downtrend in the interest rate
IL&FS Transport
2,179
66
93
40.4
cycle, to lead to stock re-rating
Economic recovery to have favourable impact on advertising &
Jagran Prakashan
6,050
185
205
10.8
circulation revenue growth. Further, the acquisition of a radio business
(Radio City) would also boost the company`s revenue growth.
Speedier execution and speedier sales, strong revenue visibility
Mahindra Lifespace
1,774
432
554
28.1
in short-to-long run, attractive valuations
Massive capacity expansion along with rail advantage at ICD as
Navkar Corporation
2,782
195
265
35.8
well CFS augurs well for the company
Earnings boost on back of stable material prices and favourable
Radico Khaitan
1,366
103
125
21.8
pricing environment. Valuation discount to peers provides
additional comfort
Strong brands and distribution network would boost growth
Siyaram Silk Mills
1,031
1,100
1,347
22.4
going ahead. Stock currently trades at an inexpensive valuation.
Market leadership in Hindi news genre and no. 2 viewership
TV Today Network
1,806
303
363
19.9
ranking in English news genre, exit from the radio business, and
anticipated growth in ad spends by corporates to benefit the stock.
Source: Company, Angel Research
Market Outlook
August 19, 2016
Key Upcoming Events
Result Calendar
Date
Company
August 20, 2016
TVS Srichakra
August 23, 2016
Tata Power Co.
August 26, 2016
Tata Motors
Source: Bloomberg, Angel Research
Global economic events release calendar
Bloomberg Data
Date
Time
Country Event Description
Unit
Period
Last Reported Estimated
Aug 23, 2016
2:30 PM Euro Zone
Euro-Zone CPI (YoY)
% Jul F
0.20
0.20
7:30 PM
US
New home sales
Thousands
Jul
592.00
577.00
11:30 AM Germany
GDP nsa (YoY)
% Change 2Q F
3.10
1:00 PM Germany
PMI Services
Value Aug P
54.40
Aug 24, 2016
1:00 PM Germany
PMI Manufacturing
Value Aug P
53.80
7:30 PM
US
Existing home sales
Million
Jul
5.57
5.55
Aug 26, 2016
6:00 PM
US
GDP Qoq (Annualised)
% Change 2Q S
1.20
1.10
2:00 PM
UK
GDP (YoY)
% Change 2Q P
2.20
Aug 30, 2016
7:30 PM
US
Consumer ConfidenceS.A./ 1985=100 Aug
97.30
97.00
Aug 31, 2016
1:25 PM Germany Unemployment change (000's)
Thousands Aug
(7.00)
Sep 01, 2016
2:00 PM
UK
PMI Manufacturing
Value Aug
48.20
6:30 AM
China
PMI Manufacturing
Value Aug
49.90
Source: Bloomberg, Angel Research
Market Outlook
August 19, 2016
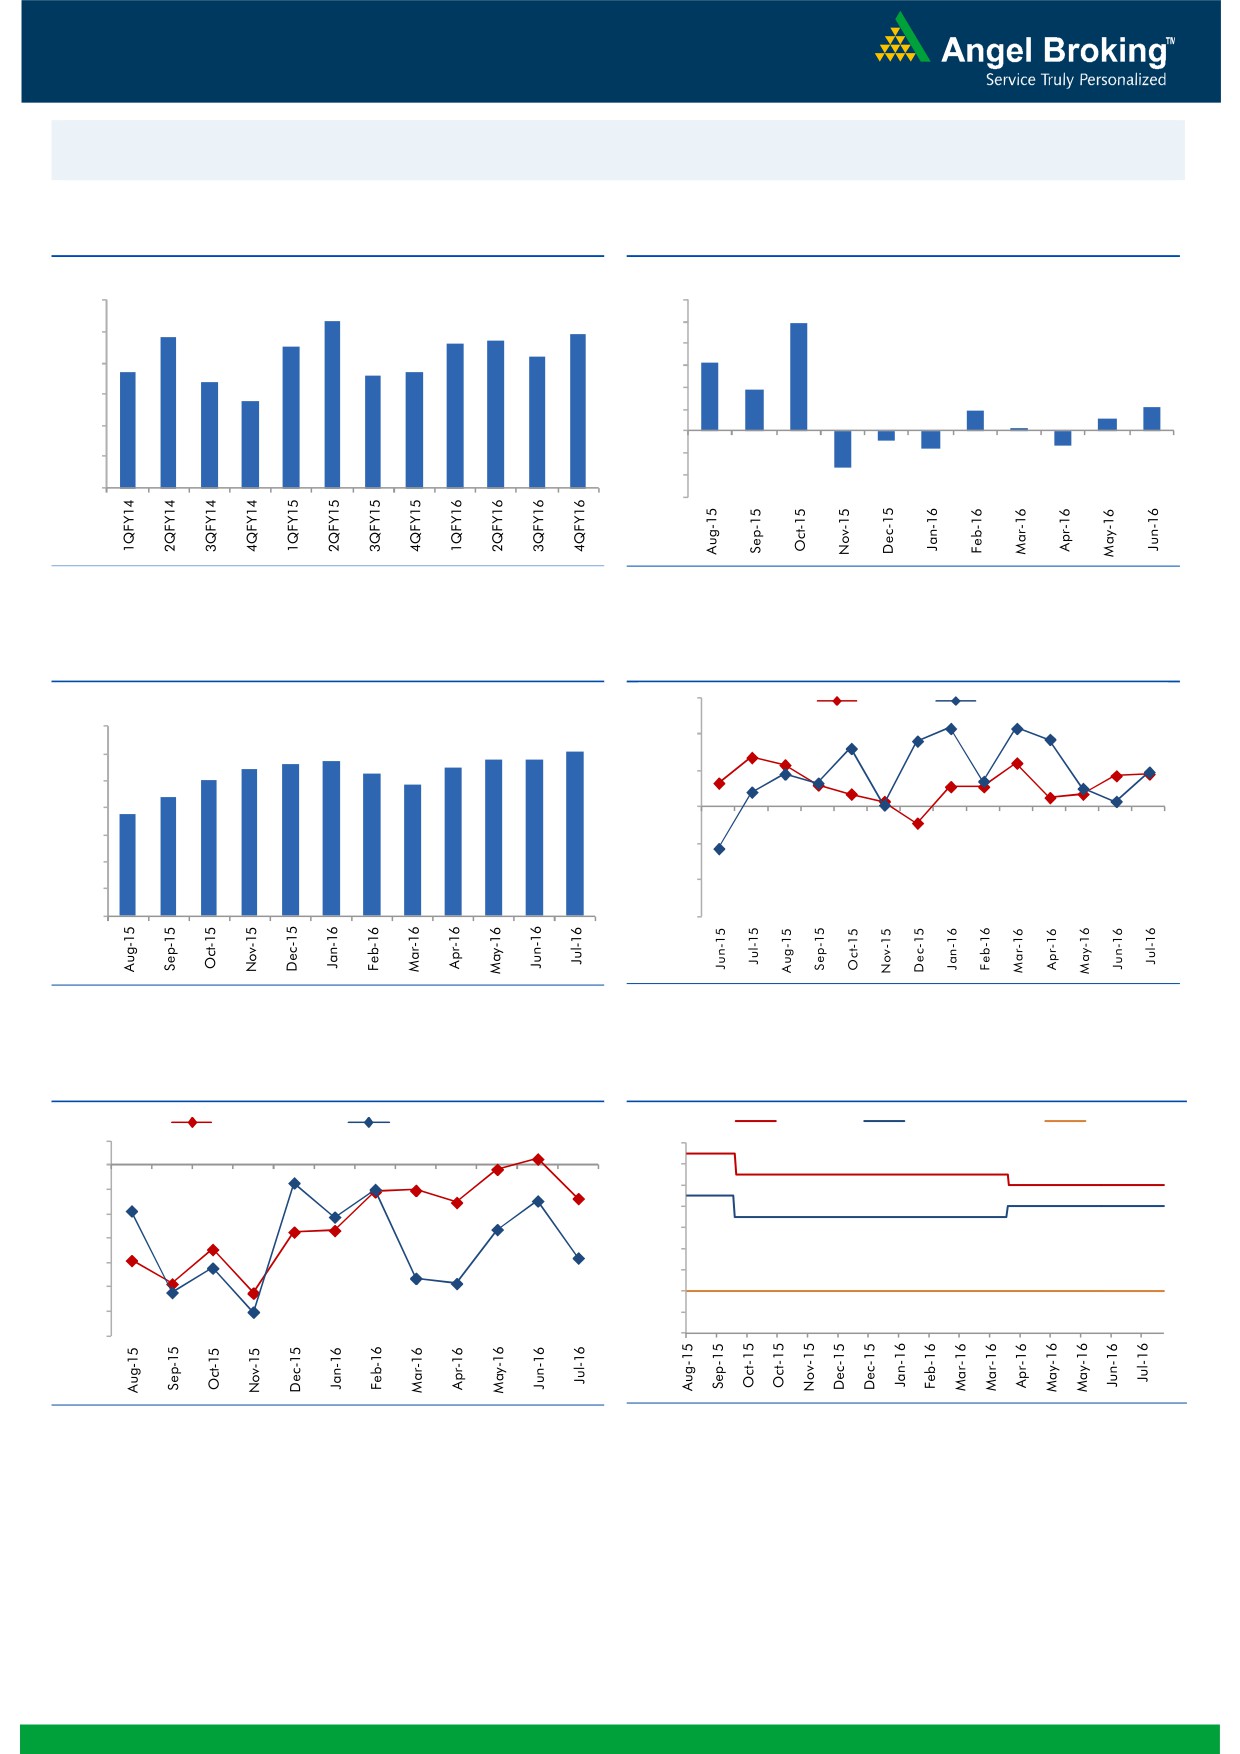
Macro watch
Exhibit 1: Quarterly GDP trends
Exhibit 2: IIP trends
(%)
(%)
9.0
12.0
8.3
9.9
7.8
7.7
7.9
10.0
8.0
7.5
7.6
7.2
8.0
6.3
6.7
6.6
6.7
7.0
6.4
6.0
3.7
5.8
4.0
6.0
1.9
2.1
1.1
2.0
0.3
5.0
-
4.0
(2.0)
(0.9)
(1.3)
(1.6)
(4.0)
3.0
(3.4)
(6.0)
Source: CSO, Angel Research
Source: MOSPI, Angel Research
Exhibit 3: Monthly CPI inflation trends
Exhibit 4: Manufacturing and services PMI
56.0
Mfg. PMI
Services PMI
(%)
7.0
6.1
54.0
5.8
5.8
5.6
5.7
5.5
6.0
5.4
5.3
5.0
4.8
52.0
5.0
4.4
3.7
4.0
50.0
3.0
48.0
2.0
46.0
1.0
-
44.0
Source: MOSPI, Angel Research
Source: Market, Angel Research; Note: Level above 50 indicates expansion
Exhibit 5: Exports and imports growth trends
Exhibit 6: Key policy rates
(%)
Exports yoy growth
Imports yoy growth
(%)
Repo rate
Reverse Repo rate
CRR
5.0
7.50
0.0
7.00
(5.0)
6.50
6.00
(10.0)
5.50
(15.0)
5.00
(20.0)
4.50
(25.0)
4.00
(30.0)
3.50
(35.0)
3.00
Source: Bloomberg, Angel Research
Source: RBI, Angel Research
Market Outlook
August 19, 2016
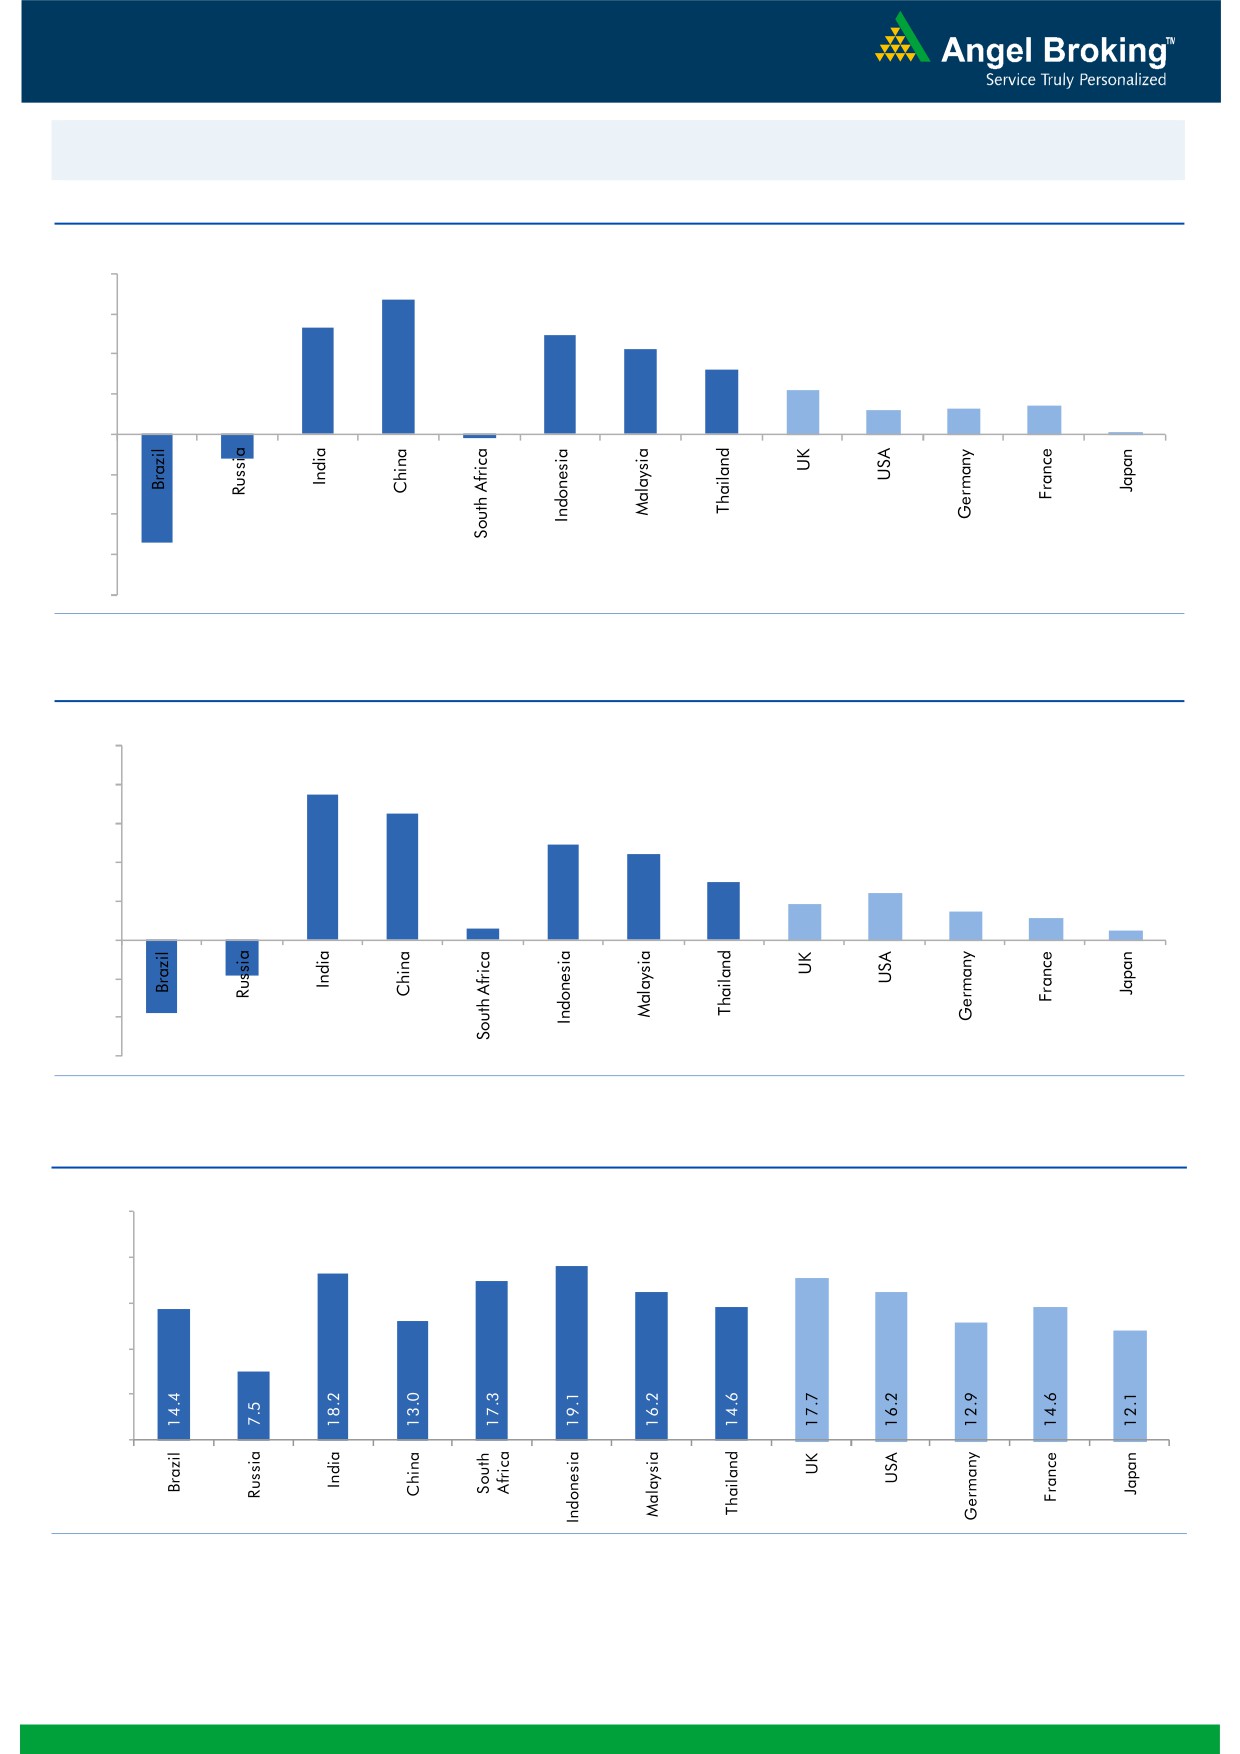
Global watch
Exhibit 1: Latest quarterly GDP Growth (%, yoy) across select developing and developed countries
(%)
8.0
6.7
6.0
5.3
4.9
4.2
4.0
3.2
2.2
1.3
1.4
2.0
1.2
0.1
-
(2.0)
(4.0)
(1.2)
(6.0)
(5.4)
(0.2)
(8.0)
Source: Bloomberg, Angel Research
Exhibit 2: 2016 GDP Growth projection by IMF (%, yoy) across select developing and developed countries
(%)
10.0
7.5
8.0
6.5
6.0
4.9
4.4
4.0
3.0
2.4
1.9
1.5
2.0
1.1
0.6
0.5
(3.8)
(1.8)
-
(2.0)
(4.0)
(6.0)
Source: IMF, Angel Research
Exhibit 3: One year forward P-E ratio across select developing and developed countries
(x)
25.0
20.0
15.0
10.0
5.0
-
Source: IMF, Angel Research
Market Outlook
August 19, 2016
Exhibit 4: Relative performance of indices across globe
Returns (%)
Country
Name of index
Closing price
1M
3M
1YR
Brazil
Bovespa
59,166
4.4
18.0
23.2
Russia
Micex
1,970
2.8
4.2
16.5
India
Nifty
8,673
1.9
10.2
2.5
China
Shanghai Composite
3,104
2.3
10.3
(21.1)
South Africa
Top 40
46,064
(0.8)
(0.7)
1.7
Mexico
Mexbol
48,437
2.9
7.3
12.5
Indonesia
LQ45
942
5.5
15.0
15.8
Malaysia
KLCI
1,695
1.5
3.8
3.6
Thailand
SET 50
988
4.8
11.5
5.3
USA
Dow Jones
18,598
0.2
6.1
9.5
UK
FTSE
6,869
2.6
13.5
11.0
Japan
Nikkei
16,746
(0.1)
(1.0)
(20.5)
Germany
DAX
10,603
6.2
6.9
9.9
France
CAC
4,437
2.5
1.9
(4.7)
Source: Bloomberg, Angel Research
Stock Watch
August 19, 2016
Company Name
Reco
CMP
Target
Mkt Cap
Sales ( Čcr )
OPM(%)
EPS (Č)
PER(x)
P/BV(x)
RoE(%)
EV/Sales(x)
(Č)
Price ( Č)
( Č cr )
FY17E FY18E
FY17E
FY18E
FY17E
FY18E
FY17E
FY18E
FY17E
FY18E
FY17E
FY18E
FY17E
FY18E
Agri / Agri Chemical
Rallis
Neutral
222
-
4,321
1,937
2,164
13.3
14.3
9.0
11.0
24.7
20.2
4.3
3.8
18.4
19.8
2.3
2.0
United Phosphorus
Accumulate
642
684
27,525
15,176
17,604
18.5
18.5
37.4
44.6
17.2
14.4
3.4
2.8
21.4
21.2
1.9
1.6
Auto & Auto Ancillary
Ashok Leyland
Buy
88
111
24,973
22,407
26,022
10.6
10.6
5.2
6.4
16.8
13.7
3.8
3.2
23.6
24.7
1.2
1.0
Bajaj Auto
Neutral
2,943
-
85,153
25,093
27,891
19.5
19.2
143.9
162.5
20.5
18.1
5.7
4.9
30.3
29.4
3.1
2.7
Bharat Forge
Neutral
841
-
19,585
7,726
8,713
20.5
21.2
35.3
42.7
23.8
19.7
4.4
4.0
18.9
20.1
2.6
2.3
Eicher Motors
Neutral
22,175
-
60,229
16,583
20,447
17.5
18.0
598.0
745.2
37.1
29.8
12.7
9.7
41.2
38.3
3.5
2.7
Gabriel India
Neutral
116
-
1,668
1,544
1,715
9.0
9.3
5.4
6.3
21.5
18.4
4.1
3.6
18.9
19.5
1.0
0.9
Hero Motocorp
Neutral
3,369
-
67,283
31,253
35,198
15.3
15.0
172.3
192.1
19.6
17.5
7.2
6.1
38.9
37.0
2.0
1.8
Jamna Auto Industries Neutral
231
-
1,842
1,486
1,620
9.8
9.9
15.0
17.2
15.4
13.4
3.4
2.9
21.8
21.3
1.3
1.2
L G Balakrishnan & Bros Neutral
463
-
726
1,302
1,432
11.6
11.9
43.7
53.0
10.6
8.7
1.5
1.4
13.8
14.2
0.6
0.6
Mahindra and Mahindra Neutral
1,460
-
90,695
46,534
53,077
11.6
11.7
67.3
78.1
21.7
18.7
3.5
3.1
15.4
15.8
1.9
1.7
Maruti
Neutral
4,917
-
148,537
69,186
82,217
14.7
14.4
198.5
241.4
24.8
20.4
4.8
3.9
20.2
20.0
1.8
1.5
Minda Industries
Neutral
1,131
-
1,794
2,728
3,042
9.0
9.1
68.2
86.2
16.6
13.1
3.8
3.0
23.8
24.3
0.7
0.6
Motherson Sumi
Neutral
335
-
44,272
45,896
53,687
7.8
8.3
13.0
16.1
25.7
20.8
8.3
6.6
34.7
35.4
1.0
0.9
Rane Brake Lining
Neutral
647
-
512
511
562
11.3
11.5
28.1
30.9
23.0
20.9
3.5
3.2
15.3
15.0
1.1
1.1
Setco Automotive
Neutral
46
-
609
741
837
13.0
13.0
15.2
17.0
3.0
2.7
0.5
0.5
15.8
16.3
1.2
1.1
Tata Motors
Neutral
512
-
147,810
300,209
338,549
8.9
8.4
42.7
54.3
12.0
9.4
1.9
1.6
15.6
17.2
0.6
0.5
TVS Motor
Accumulate
312
330
14,816
13,390
15,948
6.9
7.1
12.8
16.5
24.4
18.9
6.1
4.8
26.3
27.2
1.1
0.9
Amara Raja Batteries
Buy
920
1,076
15,715
5,717
6,733
18.7
18.9
38.4
48.9
24.0
18.8
6.0
4.9
25.3
24.8
2.6
2.1
Exide Industries
Neutral
177
-
15,041
7,439
8,307
15.0
15.0
8.1
9.3
21.9
19.0
3.1
2.7
14.3
16.7
1.6
1.5
Apollo Tyres
Neutral
177
-
9,012
12,877
14,504
14.3
13.9
21.4
23.0
8.3
7.7
1.3
1.1
16.4
15.2
0.9
0.8
Ceat
Buy
869
1,119
3,514
7,524
8,624
13.0
12.7
131.1
144.3
6.6
6.0
1.2
1.0
19.8
18.6
0.5
0.5
JK Tyres
Neutral
113
-
2,555
7,455
8,056
15.0
15.0
21.8
24.5
5.2
4.6
1.1
0.9
22.8
21.3
0.5
0.4
Swaraj Engines
Neutral
1,150
-
1,428
660
810
15.2
16.4
54.5
72.8
21.1
15.8
6.6
6.0
31.5
39.2
2.0
1.6
Subros
Neutral
105
-
631
1,488
1,681
11.7
11.9
6.4
7.2
16.4
14.7
1.7
1.6
10.8
11.4
0.7
0.6
Indag Rubber
Neutral
170
-
447
286
326
19.8
16.8
11.7
13.3
14.6
12.8
2.5
2.3
17.8
17.1
1.2
1.1
Capital Goods
ACE
Neutral
43
-
429
709
814
4.1
4.6
1.4
2.1
31.0
20.7
1.3
1.2
4.4
6.0
0.8
0.7
BEML
Accumulate
1,026
1,157
4,272
3,451
4,055
6.3
9.2
31.4
57.9
32.7
17.7
2.0
1.8
6.3
10.9
1.4
1.1
Bharat Electronics
Buy
1,226
1,414
29,423
8,137
9,169
16.8
17.2
58.7
62.5
20.9
19.6
3.2
2.9
44.6
46.3
2.6
2.3
Stock Watch
August 19, 2016
Company Name
Reco
CMP
Target
Mkt Cap
Sales ( Čcr )
OPM(%)
EPS (Č)
PER(x)
P/BV(x)
RoE(%)
EV/Sales(x)
(Č)
Price ( Č)
( Č cr )
FY17E
FY18E
FY17E
FY18E
FY17E
FY18E
FY17E
FY18E
FY17E
FY18E
FY17E
FY18E
FY17E
FY18E
Capital Goods
Voltas
Accumulate
366
407
12,102
6,511
7,514
7.9
8.7
12.9
16.3
28.4
22.4
5.1
4.5
16.7
18.5
1.6
1.4
BGR Energy
Neutral
114
-
825
16,567
33,848
6.0
5.6
7.8
5.9
14.7
19.4
0.8
0.8
4.7
4.2
0.2
0.1
BHEL
Neutral
140
-
34,303
28,797
34,742
-
2.8
2.3
6.9
60.9
20.3
1.0
1.0
1.3
4.8
0.8
0.6
Blue Star
Accumulate
490
527
4,671
4,351
5,024
6.4
7.1
17.2
20.6
28.5
23.7
18.6
15.5
23.1
24.1
1.1
1.0
Crompton Greaves
Neutral
87
-
5,481
5,777
6,120
5.9
7.0
3.3
4.5
26.5
19.4
1.2
1.1
4.4
5.9
0.9
0.8
Greaves Cotton
Neutral
140
-
3,423
1,755
1,881
16.8
16.9
7.8
8.5
18.0
16.5
3.6
3.3
20.6
20.9
1.6
1.5
Inox Wind
Buy
188
286
4,175
5,605
6,267
15.7
16.4
24.8
30.0
7.6
6.3
2.1
1.6
25.9
24.4
0.8
0.7
KEC International
Neutral
135
-
3,478
9,294
10,186
7.9
8.1
9.9
11.9
13.7
11.4
2.0
1.7
15.6
16.3
0.6
0.6
Thermax
Neutral
857
-
10,208
5,421
5,940
7.3
7.3
25.7
30.2
33.3
28.4
4.0
3.7
12.2
13.1
1.8
1.6
VATech Wabag
Buy
579
681
3,154
3,136
3,845
8.9
9.1
26.0
35.9
22.3
16.1
2.8
2.4
13.4
15.9
0.9
0.7
Cement
ACC
Neutral
1,691
-
31,753
11,225
13,172
13.2
16.9
44.5
75.5
38.0
22.4
3.6
3.3
11.2
14.2
2.8
2.4
Ambuja Cements
Neutral
272
-
42,219
9,350
10,979
18.2
22.5
5.8
9.5
46.9
28.6
3.9
3.5
10.2
12.5
4.5
3.9
India Cements
Neutral
126
-
3,858
4,364
4,997
18.5
19.2
7.9
11.3
15.9
11.1
1.1
1.1
8.0
8.5
1.6
1.4
JK Cement
Neutral
788
-
5,507
4,398
5,173
15.5
17.5
31.2
55.5
25.2
14.2
3.0
2.6
12.0
15.5
1.8
1.5
J K Lakshmi Cement
Neutral
444
-
5,223
2,913
3,412
14.5
19.5
7.5
22.5
59.2
19.7
3.6
3.1
12.5
18.0
2.4
2.0
Orient Cement
Neutral
167
-
3,419
2,114
2,558
18.5
20.5
8.1
11.3
20.6
14.8
3.0
2.6
9.0
14.0
2.2
1.8
UltraTech Cement
Neutral
3,871
-
106,240
25,768
30,385
21.0
23.5
111.0
160.0
34.9
24.2
4.5
3.9
13.5
15.8
4.2
3.5
Construction
ITNL
Buy
66
93
2,179
8,946
10,017
31.0
31.6
8.1
9.1
8.2
7.3
0.3
0.3
4.2
5.0
3.6
3.3
KNR Constructions
Neutral
712
-
2,001
1,210
1,595
15.4
16.0
33.9
52.1
21.0
13.7
3.2
2.8
13.6
18.0
1.7
1.2
Larsen & Toubro
Accumulate
1,483
1,700
138,184
67,665
77,249
10.7
11.5
57.3
71.2
25.9
20.8
2.4
2.2
12.6
14.3
2.2
1.9
Gujarat Pipavav Port
Neutral
174
-
8,429
705
788
52.2
51.7
5.0
5.6
34.9
31.1
3.4
3.1
11.2
11.2
11.6
9.9
MBL Infrastructures
Buy
121
285
500
2,797
3,405
14.7
15.4
21.0
34.8
5.7
3.5
0.6
0.5
11.0
16.2
0.8
0.8
Nagarjuna Const.
Neutral
86
-
4,787
8,842
9,775
9.1
8.8
5.3
6.4
16.3
13.5
1.3
1.2
8.2
9.1
0.7
0.6
PNC Infratech
Buy
117
647
2,996
2,350
2,904
13.4
13.7
48.0
42.0
2.4
2.8
0.5
0.4
16.8
13.2
1.4
1.1
Simplex Infra
Neutral
298
-
1,475
6,829
7,954
10.5
10.5
31.4
37.4
9.5
8.0
1.0
0.9
9.9
13.4
0.6
0.5
Power Mech Projects
Neutral
536
-
789
1,801
2,219
12.7
14.6
72.1
113.9
7.4
4.7
1.4
1.2
16.8
11.9
0.4
0.3
Sadbhav Engineering
Neutral
288
-
4,937
3,598
4,140
10.3
10.6
9.0
11.9
32.0
24.2
3.4
2.9
9.9
11.9
1.7
1.4
NBCC
Neutral
242
-
14,517
7,428
9,549
7.9
8.6
8.2
11.0
29.5
22.0
1.5
1.2
28.2
28.7
1.7
1.2
MEP Infra
Neutral
41
-
673
1,877
1,943
30.6
29.8
3.0
4.2
13.8
9.9
6.7
4.5
0.6
0.6
1.7
1.6
Stock Watch
August 19, 2016
Company Name
Reco
CMP
Target
Mkt Cap
Sales ( Čcr )
OPM(%)
EPS (Č)
PER(x)
P/BV(x)
RoE(%)
EV/Sales(x)
(Č)
Price ( Č)
( Č cr )
FY17E
FY18E
FY17E
FY18E
FY17E
FY18E
FY17E
FY18E
FY17E
FY18E
FY17E
FY18E
FY17E
FY18E
Construction
SIPL
Neutral
97
-
3,406
1,036
1,252
65.5
66.2
(8.4)
(5.6)
3.6
4.1
(22.8)
(15.9)
11.5
9.6
Engineers India
Neutral
228
-
7,696
1,725
1,935
16.0
19.1
11.4
13.9
20.0
16.4
2.8
2.7
13.4
15.3
3.4
3.0
Financials
Axis Bank
Neutral
593
-
141,535
58,081
66,459
3.5
3.5
32.4
44.6
18.3
13.3
2.4
2.1
13.6
16.5
-
-
Bank of Baroda
Neutral
155
-
35,622
19,980
23,178
1.8
1.8
11.5
17.3
13.4
8.9
1.5
1.3
8.3
10.1
-
-
Canara Bank
Neutral
265
-
14,378
15,225
16,836
1.8
1.8
14.5
28.0
18.3
9.5
1.3
1.0
5.8
8.5
-
-
Dewan Housing Finance Neutral
266
-
7,772
2,225
2,688
2.9
2.9
29.7
34.6
9.0
7.7
1.5
1.2
16.1
16.8
-
-
Equitas Holdings
Buy
180
235
6,030
939
1,281
11.7
11.5
5.8
8.2
31.0
21.9
2.7
2.4
10.9
11.5
-
-
Federal Bank
Neutral
65
-
11,142
9,353
10,623
2.9
2.9
4.4
5.8
14.7
11.2
1.4
1.3
9.5
11.0
-
-
HDFC
Neutral
1,374
-
217,248
11,475
13,450
3.4
3.4
45.3
52.5
30.3
26.2
5.9
5.2
20.2
20.5
-
-
HDFC Bank
Accumulate
1,251
1,350
316,771
46,097
55,433
4.5
4.5
58.4
68.0
21.4
18.4
3.8
3.1
18.8
18.6
-
-
ICICI Bank
Neutral
253
-
147,081
39,029
45,903
3.3
3.3
16.7
16.3
15.1
15.5
1.9
1.7
10.1
12.4
-
-
LIC Housing Finance
Neutral
554
-
27,976
3,712
4,293
2.6
2.5
39.0
46.0
14.2
12.1
2.7
2.3
19.9
20.1
-
-
Punjab Natl.Bank
Neutral
127
-
24,849
23,532
23,595
2.3
2.4
6.8
12.6
18.6
10.0
2.9
2.0
3.3
6.5
-
-
South Ind.Bank
Neutral
22
-
2,923
6,435
7,578
2.5
2.5
2.7
3.1
8.0
7.0
1.0
0.9
10.1
11.2
-
-
St Bk of India
Neutral
248
-
192,672
88,650
98,335
2.6
2.6
13.5
18.8
18.4
13.2
1.8
1.5
7.0
8.5
-
-
Union Bank
Neutral
133
-
9,174
13,450
14,925
2.3
2.3
25.5
34.5
5.2
3.9
0.8
0.7
7.5
10.2
-
-
Yes Bank
Neutral
1,321
-
55,595
8,978
11,281
3.3
3.4
74.0
90.0
17.9
14.7
3.4
2.9
17.0
17.2
-
-
FMCG
Asian Paints
Neutral
1,109
-
106,332
17,128
18,978
16.8
16.4
19.1
20.7
58.0
53.6
20.2
19.1
34.8
35.5
6.1
5.5
Britannia
Neutral
3,319
-
39,824
9,795
11,040
14.6
14.9
80.3
94.0
41.3
35.3
17.0
13.1
41.2
-
3.9
3.4
Colgate
Neutral
968
-
26,334
4,605
5,149
23.4
23.4
23.8
26.9
40.7
36.0
22.5
17.6
64.8
66.8
5.6
5.0
Dabur India
Neutral
302
-
53,188
8,315
9,405
19.8
20.7
8.1
9.2
37.3
32.9
10.4
8.6
31.6
31.0
6.0
5.3
GlaxoSmith Con*
Neutral
6,328
-
26,611
4,350
4,823
21.2
21.4
179.2
196.5
35.3
32.2
9.4
7.9
27.1
26.8
5.5
4.9
Godrej Consumer
Neutral
1,529
-
52,066
10,235
11,428
18.4
18.6
41.1
44.2
37.2
34.6
8.3
7.0
24.9
24.8
5.2
4.6
HUL
Neutral
907
-
196,189
35,252
38,495
17.6
17.4
20.4
21.9
44.4
41.4
36.5
32.0
82.2
77.3
5.4
4.9
ITC
Accumulate
252
283
304,426
40,059
44,439
39.0
39.2
9.1
10.1
27.7
25.0
7.6
6.6
27.2
26.5
7.1
6.4
Marico
Neutral
301
-
38,770
6,430
7,349
18.8
19.5
6.4
7.7
47.0
39.0
14.2
11.9
33.2
32.5
5.8
5.1
Nestle*
Neutral
6,700
-
64,595
10,073
11,807
20.7
21.5
124.8
154.2
53.7
43.5
22.0
19.8
34.8
36.7
6.2
5.3
Tata Global
Neutral
139
-
8,763
8,675
9,088
9.8
9.8
7.4
8.2
18.8
16.9
2.1
2.0
7.9
8.1
0.9
0.9
Procter & Gamble
Neutral
7,028
-
22,813
2,939
3,342
23.2
23.0
146.2
163.7
48.1
42.9
107.6
103.2
25.3
23.5
7.3
6.4
Hygiene
Stock Watch
August 19, 2016
Company Name
Reco
CMP
Target
Mkt Cap
Sales ( Čcr )
OPM(%)
EPS (Č)
PER(x)
P/BV(x)
RoE(%)
EV/Sales(x)
(Č)
Price ( Č)
( Č cr )
FY17E FY18E
FY17E
FY18E
FY17E
FY18E
FY17E
FY18E
FY17E
FY18E
FY17E
FY18E
FY17E
FY18E
IT
HCL Tech^
Buy
786
1,000
110,822
49,242
57,168
20.5
20.5
55.7
64.1
14.1
12.3
2.9
2.2
20.3
17.9
2.1
1.7
Infosys
Buy
1,024
1,370
235,276
69,934
79,025
27.5
27.5
64.8
72.0
15.8
14.2
3.5
3.2
22.0
22.3
2.8
2.4
TCS
Accumulate
2,637
3,004
519,543
121,684
136,286
27.3
27.3
135.0
150.1
19.5
17.6
6.5
6.0
33.2
33.9
4.0
3.6
Tech Mahindra
Buy
469
700
45,570
30,347
33,685
17.0
17.0
37.5
41.3
12.5
11.4
2.7
2.4
21.8
20.7
1.2
1.1
Wipro
Buy
525
680
129,663
51,631
55,822
21.7
17.9
35.9
36.9
14.6
14.2
3.1
2.8
19.0
18.1
2.2
2.0
Media
D B Corp
Neutral
406
-
7,456
2,297
2,590
27.4
28.2
21.0
23.4
19.3
17.3
4.5
3.9
23.7
23.1
3.0
2.6
HT Media
Neutral
78
-
1,825
2,693
2,991
12.6
12.9
7.9
9.0
9.9
8.7
0.8
0.8
7.8
8.3
0.3
0.1
Jagran Prakashan
Accumulate
185
205
6,050
2,355
2,635
28.0
28.0
9.9
10.8
18.7
17.1
3.7
3.2
21.7
21.7
2.6
2.3
Sun TV Network
Neutral
484
-
19,087
2,850
3,265
70.1
71.0
26.2
30.4
18.5
15.9
4.7
4.2
24.3
25.6
6.3
5.4
Hindustan Media
Neutral
270
-
1,982
1,016
1,138
24.3
25.2
27.3
30.1
9.9
9.0
1.9
1.7
16.2
15.8
1.3
1.1
Ventures
TV Today Network
Buy
303
363
1,806
637
743
27.5
27.5
18.4
21.4
16.5
14.2
2.9
2.4
17.4
17.2
2.4
2.0
Metals & Mining
Coal India
Neutral
339
-
213,998
84,638
94,297
21.4
22.3
24.5
27.1
13.8
12.5
5.8
5.5
42.6
46.0
2.0
1.8
Hind. Zinc
Neutral
228
-
96,337
14,252
18,465
55.9
48.3
15.8
21.5
14.4
10.6
2.4
2.1
17.0
20.7
6.8
5.2
Hindalco
Neutral
154
-
31,852
107,899
112,095
7.4
8.2
9.2
13.0
16.8
11.9
0.8
0.8
4.8
6.6
0.8
0.8
JSW Steel
Neutral
1,780
-
43,025
53,201
58,779
16.1
16.2
130.6
153.7
13.6
11.6
1.8
1.6
14.0
14.4
1.6
1.4
NMDC
Neutral
107
-
42,284
6,643
7,284
44.4
47.7
7.1
7.7
15.0
13.9
1.3
1.3
8.8
9.2
4.1
3.7
SAIL
Neutral
48
-
19,866
47,528
53,738
(0.7)
2.1
(1.9)
2.6
18.5
0.5
0.5
(1.6)
3.9
1.3
1.2
Vedanta
Neutral
173
-
51,260
71,744
81,944
19.2
21.7
13.4
20.1
12.9
8.6
1.1
1.0
8.4
11.3
1.1
0.8
Tata Steel
Neutral
387
-
37,605
121,374
121,856
7.2
8.4
18.6
34.3
20.8
11.3
1.3
1.2
6.1
10.1
0.9
0.9
Oil & Gas
Cairn India
Neutral
202
-
37,928
9,127
10,632
4.3
20.6
8.8
11.7
23.0
17.3
0.7
0.7
3.3
4.2
5.6
4.6
GAIL
Neutral
366
-
46,376
56,220
65,198
9.3
10.1
27.1
33.3
13.5
11.0
1.2
1.2
9.3
10.7
1.0
0.9
ONGC
Neutral
241
-
206,016
137,222
152,563
15.0
21.8
19.5
24.1
12.4
10.0
1.1
1.0
8.5
10.1
1.8
1.6
Petronet LNG
Neutral
327
-
24,510
-
0
-
-
-
-
-
-
Indian Oil Corp
Neutral
562
-
136,451
373,359
428,656
5.9
5.5
54.0
59.3
10.4
9.5
1.6
1.5
16.0
15.6
0.5
0.4
Reliance Industries
Neutral
1,017
-
329,627
301,963
358,039
12.1
12.6
87.7
101.7
11.6
10.0
1.2
1.1
10.7
11.3
1.6
1.3
Pharmaceuticals
Alembic Pharma
Neutral
642
-
12,094
3,483
4,083
20.2
21.4
24.3
30.4
26.4
21.1
6.0
4.8
25.5
25.3
3.4
2.8
Aurobindo Pharma
Buy
754
877
44,101
15,720
18,078
23.7
23.7
41.4
47.3
18.2
15.9
4.7
3.7
29.6
26.1
3.0
2.6
Aventis*
Neutral
4,337
-
9,989
2,357
2,692
17.3
17.3
153.5
169.2
28.3
25.6
4.8
3.9
25.8
28.4
3.9
3.2
Cadila Healthcare
Accumulate
367
400
37,617
11,126
13,148
22.0
22.0
17.1
20.0
21.5
18.4
5.5
4.4
28.8
26.6
3.4
2.8
Stock Watch
August 19, 2016
Company Name
Reco
CMP
Target
Mkt Cap
Sales ( Čcr )
OPM(%)
EPS (Č)
PER(x)
P/BV(x)
RoE(%)
EV/Sales(x)
(Č)
Price ( Č)
( Č cr )
FY17E FY18E
FY17E
FY18E
FY17E
FY18E
FY17E
FY18E
FY17E
FY18E
FY17E
FY18E
FY17E
FY18E
Pharmaceuticals
Cipla
Reduce
552
490
44,325
15,378
18,089
17.4
18.4
21.6
27.2
25.5
20.3
3.3
2.9
13.7
15.2
3.1
2.6
Dr Reddy's
Neutral
3,028
-
51,631
16,043
18,119
23.1
24.7
126.0
157.8
24.0
19.2
3.5
3.1
15.7
17.1
3.2
2.8
Dishman Pharma
Sell
174
45
2,808
1,718
1,890
22.7
22.8
9.5
11.3
18.3
15.4
1.8
1.6
10.1
10.9
2.1
1.8
GSK Pharma*
Neutral
3,145
-
26,636
3,528
3,811
16.6
18.8
51.8
59.4
60.7
52.9
16.2
16.2
26.3
30.6
7.3
6.8
Indoco Remedies
Sell
305
225
2,811
1,112
1,289
18.2
18.2
13.2
15.6
23.1
19.6
4.1
3.5
19.2
19.2
2.6
2.3
Ipca labs
Buy
517
613
6,527
3,303
3,799
15.3
15.3
17.3
19.7
29.9
26.3
2.6
2.4
9.1
9.4
2.1
1.8
Lupin
Accumulate
1,590
1,809
71,679
15,912
18,644
26.4
26.7
58.1
69.3
27.4
22.9
5.3
4.4
21.4
20.9
4.6
3.8
Sun Pharma
Buy
789
944
189,828
31,129
35,258
30.0
30.9
28.0
32.8
28.2
24.1
4.3
3.6
18.7
18.9
5.7
4.8
Power
Tata Power
Neutral
77
-
20,799
36,916
39,557
17.4
27.1
5.1
6.3
15.1
12.2
1.3
1.2
9.0
10.3
1.6
1.4
NTPC
Neutral
167
-
137,864
86,605
95,545
17.5
20.8
11.8
13.4
14.2
12.5
1.4
1.3
10.5
11.1
2.9
2.9
Power Grid
Neutral
182
-
95,189
25,763
29,762
74.3
73.1
14.8
17.3
12.3
10.5
1.9
1.7
16.9
17.5
8.0
7.6
Real Estate
MLIFE
Buy
432
554
1,774
925
1,139
18.4
22.3
18.3
33.8
23.6
12.8
1.1
1.1
4.9
8.5
2.6
2.1
Telecom
Bharti Airtel
Neutral
352
-
140,868
105,086
114,808
34.5
34.7
12.2
16.4
28.9
21.5
2.0
1.8
6.8
8.4
2.3
2.0
Idea Cellular
Neutral
94
-
33,740
40,133
43,731
37.2
37.1
6.4
6.5
14.6
14.4
1.2
1.1
8.2
7.6
1.9
1.6
zOthers
Abbott India
Neutral
4,683
-
9,950
3,153
3,583
14.1
14.4
152.2
182.7
30.8
25.6
151.1
129.0
25.6
26.1
2.9
2.5
Bajaj Electricals
Accumulate
253
277
2,558
5,099
5,805
5.7
5.9
11.4
14.6
22.3
17.4
3.0
2.6
13.4
15.1
0.5
0.4
Finolex Cables
Neutral
430
-
6,576
2,883
3,115
12.0
12.1
14.2
18.6
30.3
23.1
16.1
14.1
15.8
14.6
2.0
1.8
Goodyear India*
Buy
547
631
1,261
1,598
1,704
10.4
10.2
49.4
52.6
11.1
10.4
51.1
44.8
18.2
17.0
0.5
62.3
Hitachi
Neutral
1,411
-
3,836
2,081
2,433
8.8
8.9
33.4
39.9
42.2
35.4
34.1
28.4
22.1
21.4
1.8
1.5
Jyothy Laboratories
Neutral
285
-
5,156
1,440
2,052
11.5
13.0
8.5
10.0
33.5
28.5
8.1
7.5
18.6
19.3
3.9
2.7
MRF
Buy
36,578
45,575
15,513
-
0
-
-
-
-
-
-
Page Industries
Neutral
14,174
-
15,809
2,450
3,124
20.1
17.6
299.0
310.0
47.4
45.7
315.7
241.0
47.1
87.5
6.5
5.1
Relaxo Footwears
Neutral
466
-
5,593
2,085
2,469
9.2
8.2
7.6
8.0
61.6
58.6
23.9
20.4
17.9
18.8
2.8
2.4
Siyaram Silk Mills
Buy
1,100
1,347
1,031
1,799
2,040
11.6
11.7
104.9
122.4
10.5
9.0
1.7
1.5
16.4
16.4
0.8
0.7
Styrolution ABS India*
Neutral
564
-
992
1,440
1,537
9.2
9.0
40.6
42.6
13.9
13.2
35.5
32.3
12.3
11.6
0.6
0.6
TVS Srichakra
Buy
2,526
2,932
1,934
2,304
2,614
13.7
13.8
231.1
266.6
10.9
9.5
283.8
223.4
33.9
29.3
0.8
0.7
HSIL
Neutral
342
-
2,473
2,384
2,515
15.8
16.3
15.3
19.4
22.4
17.6
22.2
19.1
7.8
9.3
1.2
1.1
Kirloskar Engines India
Neutral
288
-
4,161
2,554
2,800
9.9
10.0
10.5
12.1
27.4
23.8
11.5
10.8
10.7
11.7
1.3
1.1
Ltd
M M Forgings
Neutral
411
-
496
546
608
20.4
20.7
41.3
48.7
10.0
8.4
56.3
49.8
16.6
17.0
0.8
0.7
Stock Watch
August 19, 2016
Company Name
Reco
CMP
Target
Mkt Cap
Sales ( Čcr )
OPM(%)
EPS (Č)
PER(x)
P/BV(x)
RoE(%)
EV/Sales(x)
(Č)
Price ( Č)
( Č cr )
FY17E
FY18E
FY17E
FY18E
FY17E
FY18E
FY17E
FY18E
FY17E
FY18E
FY17E
FY18E
FY17E
FY18E
zOthers
Banco Products (India) Neutral
218
-
1,559
1,353
1,471
12.3
12.4
14.5
16.3
15.0
13.4
20.8
18.7
14.5
14.6
1.1
117.4
Competent Automobiles Neutral
157
-
97
1,137
1,256
3.1
2.7
28.0
23.6
5.6
6.7
30.3
27.3
14.3
11.5
0.1
0.1
Nilkamal
Neutral
1,182
-
1,763
1,995
2,165
10.7
10.4
69.8
80.6
16.9
14.7
67.5
58.7
16.6
16.5
0.9
0.8
Visaka Industries
Neutral
158
-
250
1,051
1,138
10.3
10.4
21.0
23.1
7.5
6.8
20.2
18.9
9.0
9.2
0.5
0.5
Transport Corporation of
Neutral
358
-
2,741
2,671
2,911
8.5
8.8
13.9
15.7
25.8
22.9
3.5
3.2
13.7
13.8
1.1
1.0
India
Elecon Engineering
Accumulate
57
63
620
1,482
1,660
13.7
14.5
3.9
5.8
14.6
9.8
3.4
3.2
7.8
10.9
0.7
0.7
Surya Roshni
Buy
174
201
760
3,342
3,625
7.8
7.5
17.3
19.8
10.0
8.8
19.1
15.3
10.5
10.8
0.5
0.4
MT Educare
Neutral
127
-
505
366
417
17.7
18.2
9.4
10.8
13.5
11.7
3.0
2.6
22.2
22.3
1.3
1.1
Radico Khaitan
Buy
103
125
1,366
1,659
1,802
13.0
13.2
6.3
7.4
16.2
13.9
1.4
1.3
8.6
9.3
1.3
1.1
Garware Wall Ropes
Neutral
511
-
1,117
873
938
12.9
13.1
30.9
34.9
16.5
14.6
2.6
2.2
15.7
15.2
1.2
1.1
Wonderla Holidays
Neutral
401
-
2,266
287
355
38.0
40.0
11.3
14.2
35.5
28.2
5.1
4.5
21.4
23.9
7.6
6.1
Linc Pen & Plastics
Accumulate
258
283
381
382
420
9.3
9.5
13.5
15.7
19.2
16.4
3.3
2.8
17.1
17.3
1.1
1.0
The Byke Hospitality
Neutral
161
-
645
287
384
20.5
20.5
7.6
10.7
21.2
15.0
4.4
3.6
20.7
23.5
2.3
1.7
Interglobe Aviation
Neutral
880
-
31,724
21,122
26,005
14.5
27.6
110.7
132.1
8.0
6.7
47.6
34.0
168.5
201.1
1.5
1.2
Coffee Day Enterprises
Neutral
241
-
4,965
2,964
3,260
20.5
21.2
4.7
8.0
-
30.1
2.8
2.6
5.5
8.5
2.1
1.9
Ltd
Navneet Education
Neutral
101
-
2,395
1,062
1,147
24.0
24.0
6.1
6.6
16.5
15.2
3.4
3.0
20.6
19.8
2.3
2.2
Navkar Corporation
Buy
195
265
2,782
408
612
42.9
42.3
6.8
11.5
28.8
17.0
2.0
1.8
6.9
10.5
7.7
5.2
UFO Moviez
Neutral
508
-
1,401
619
685
33.2
33.4
30.0
34.9
16.9
14.6
2.3
2.0
13.8
13.9
2.0
1.6
VRL Logistics
Neutral
305
-
2,780
1,902
2,119
16.7
16.6
14.6
16.8
20.9
18.1
4.6
4.0
21.9
22.2
1.6
1.4
Team Lease Serv.
Neutral
1,061
-
1,814
3,229
4,001
1.5
1.8
22.8
32.8
46.6
32.3
5.0
4.3
10.7
13.4
0.5
0.4
S H Kelkar & Co.
Neutral
292
-
4,222
1,036
1,160
15.1
15.0
6.1
7.2
47.8
40.7
5.1
4.7
10.7
11.5
3.9
3.5
Quick Heal
Neutral
240
-
1,679
408
495
27.3
27.0
7.7
8.8
31.0
27.3
2.9
2.9
9.3
10.6
3.3
2.7
Narayana Hrudaya
Neutral
305
-
6,225
1,873
2,166
11.5
11.7
2.6
4.0
115.2
76.8
7.1
6.4
6.1
8.3
3.4
2.9
Manpasand Bever.
Neutral
723
-
3,618
836
1,087
19.6
19.4
16.9
23.8
42.8
30.4
5.1
4.5
12.0
14.8
4.1
3.0
Parag Milk Foods
Neutral
318
-
2,675
1,919
2,231
9.3
9.6
9.5
12.9
33.7
24.6
5.2
4.3
15.5
17.5
1.5
1.3
Source: Company, Angel Research; Note: *December year end; #September year end; &October year end; Price as on August 18, 2016
Market Outlook
August 19, 2016
Research Team Tel: 022 - 39357800
DISCLAIMER
Angel Broking Private Limited (hereinafter referred to as “Angel”) is a registered Member of National Stock Exchange of India
Limited,Bombay Stock Exchange Limited and Metropolitan Stock Exchange Limited. It is also registered as a Depository Participant with
CDSL and Portfolio Manager with SEBI. It also has registration with AMFI as a Mutual Fund Distributor. Angel Broking Private Limited is a
registered entity with SEBI for Research Analyst in terms of SEBI (Research Analyst) Regulations, 2014 vide registration number
INH000000164. Angel or its associates has not been debarred/ suspended by SEBI or any other regulatory authority for accessing
/dealing in securities Market. Angel or its associates/analyst has not received any compensation / managed or
co-managed public offering of securities of the company covered by Analyst during the past twelve months.
This document is solely for the personal information of the recipient, and must not be singularly used as the basis of any investment
decision. Nothing in this document should be construed as investment or financial advice. Each recipient of this document should make
such investigations as they deem necessary to arrive at an independent evaluation of an investment in the securities of the companies
referred to in this document (including the merits and risks involved), and should consult their own advisors to determine the merits and
risks of such an investment.
Reports based on technical and derivative analysis center on studying charts of a stock's price movement, outstanding positions and
trading volume, as opposed to focusing on a company's fundamentals and, as such, may not match with a report on a company's
fundamentals. Investors are advised to refer the Fundamental and Technical Research Reports available on our website to evaluate the
contrary view, if any.
The information in this document has been printed on the basis of publicly available information, internal data and other reliable
sources believed to be true, but we do not represent that it is accurate or complete and it should not be relied on as such, as this
document is for general guidance only. Angel Broking Pvt. Limited or any of its affiliates/ group companies shall not be in any way
responsible for any loss or damage that may arise to any person from any inadvertent error in the information contained in this report.
Angel Broking Pvt. Limited has not independently verified all the information contained within this document. Accordingly, we cannot
testify, nor make any representation or warranty, express or implied, to the accuracy, contents or data contained within this document.
While Angel Broking Pvt. Limited endeavors to update on a reasonable basis the information discussed in this material, there may be
regulatory, compliance, or other reasons that prevent us from doing so.
This document is being supplied to you solely for your information, and its contents, information or data may not be reproduced,
redistributed or passed on, directly or indirectly.
Neither Angel Broking Pvt. Limited, nor its directors, employees or affiliates shall be liable for any loss or damage that may arise from
or in connection with the use of this information.